
Steady Momentum Continues
![]() Update on Capital Relief Trades in Europe (PDF Version)
Update on Capital Relief Trades in Europe (PDF Version)
Executive Summary
This article serves as an update to our original, in-depth report on credit risk transfer / capital relief trades (CRTs) published in the summer of 2018 (see here). Over the past year, primary supply of CRT tranches looks to have remained broadly range-bound, with the greater prominence of supras and development banks as protection buyers emerging as an interesting trend. Demand technicals have also remained stable, with the buyer base concentrated among the (still) few alternative credit funds that have long dominated as protection sellers, despite efforts at bringing in new investor types. CRT pricing has remained sticky, with the range of clearing spreads (8-12% typically) continuing to be enveloped – in our view – by the return thresholds of the buyer base on the one hand, and the implied cost of bank equity on the other. CRT pricing certainly looks dislocated relative to the superior historical credit performance of the asset class, as highlighted very recently in the EBA STS discussion paper which analyses the feasibility of an STS framework for synthetic (balance sheet) transactions. Returns of 8-12% for (historical) reference portfolio loss risks of less than 20bps underscores the compelling value in CRTs (after allowing for tranche leverage and any first-loss retention).
Regulatory developments have been more notable in the past year. CRTs fell under the Securitisation Regulation net from the beginning of 2019, being subject more specifically to the ESMA disclosure framework, compliance with which we feel is unlikely to prove seamless for CRT from a practical perspective. The extension of STS criteria to CRT, as recommended by EBA in the discussion paper (subject to additional criteria) is on the other hand a positive development for the sector. In our view, such endorsement could be (potentially) transformational ultimately, though any STS labelling is unlikely to have any immediate effects considering the current tendency for senior tranche retention and also an investor base that is generally unconstrained by regulatory capital considerations. CRT structures have seen few changes since a year ago, arguably the most noteworthy being the trend for thicker tranches (increasingly split into dual tranches for cost-optimization) as a means to achieving significant/commensurate risk transfer. The treatment of excess spread remains a key structuring consideration for protection buyers, with further regulatory guidance still forthcoming in this regard (the EBA discussion paper suggests exclusion of synthetic excess spread as a criterion for the STS label).
Going forward, we believe there remains a strong impetus for CRT issuance as bank equity remains precious, particularly with the CRR roll-out from next year and the full force of the Basel III capital framework taking effect in 2022. Maturity of the demand side is where we see the greatest potential upside for the CRT market, though we are cautious as to if/ when this might happen. Regulatory inclusion is arguably the most important factor in unlocking mainstream investor liquidity in the asset class, with better transparency also key, in our view. The US CRT market, which benefits from pricing and liquidity not dissimilar to highly commoditized spread products, is clear evidence of the upside that can come with greater liberalisation of the CRT buyside in Europe.
Market Technicals
Stable Primary Market Momentum
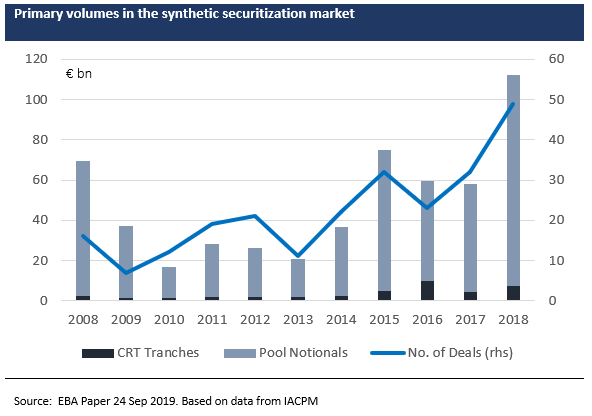
Since our last report on CRTs in mid-2018, the market as described by supply / demand technical has largely remained unchanged. Based on data from SCI, placed CRT tranches amounted to EUR 5.26 bn for the 12 months to July 2019, flat versus the EUR 5.48bn seen in the preceding 12-month period. Data released very recently in the EBA discussion paper (citing the IACPM data collection as the source) show broadly similar trends in terms of steady primary volumes measured by placed tranches although year-on-year some variations occur. We estimate reference pool notionals related to such European issuance at around EUR 69 bn versus EUR 80 bn in the preceding year, with the lower portfolio amount (but similar primary volumes) explained by thicker tranche sizes recently, as we outline below. Notably, the CRT deal count increased from 33 to 43 over the two 12-month periods, according to SCI data. Pool notional and deal count data from the recent EBA report (based separately on notifications by domestic regulators in Europe including the ECB) is again broadly consistent as far as we can see although again fluctuating year-on-year relative to IACPM or SCI data.
We repeat the important caveat that these figures are likely to somewhat understate the full extent of CRT activity in Europe. Private deal flow in the European CRT market, to include purely bilateral transactions, will not necessarily be captured by the data, yet make up a relatively significant portion of the market. Based on IACPM data recently published, which covers the entire synthetic securitization universe, only 18.6% of cumulative deal flow since 2008 until end 2018 was placed publicly (the remainder being private trades), with this ratio standing at 32% in 2018.
UK and German ‘SIFI’ banks continue to be the most active CRT issuers overall, but we note that Spain has seen a bigger market representation in the last 12 months, courtesy mostly of Santander. (We would add that the reference assets in this respect have been multi-jurisdictional). Interestingly, EIF/EIB-related transactions have featured more prominently in Italian and Spanish-sponsored deals as well as in some transactions from Central European institutions (namely Poland and Czech Republic).
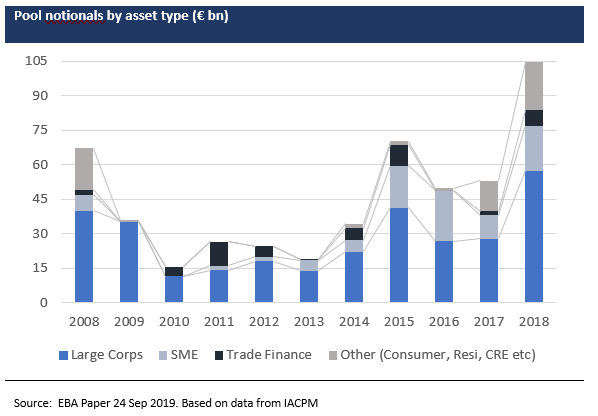
In terms of underlying portfolios, reference assets in Europe continue to be focussed on corporate and SME loans for the most part. However, this past year has witnessed an uptick in non-corporate reference portfolios, such as auto and consumer loans (via both tranched synthetic and full-stack true sale deals) plus selective residential and commercial real estate loans as well as project finance / infrastructure loan portfolios. As mentioned above, multi-jurisdictional portfolios are increasingly seen in the CRT market, indeed recent IACPM data points to the dominance of multi-jurisdictional risk transfer within the overall universe of synthetic securitizations (60%, to be precise), though our isolation of European bank CRT data suggest a more moderate share. As synthetic technology can efficiently facilitate the securitization of multi-country risk (certainly relative to cash securitizations), we expect to see more by way of such deals by European banks going forward.
Issuer Developments
Notable New Entrants
Large IRB banks continue to dominate the CRT market in Europe. Their market footprint has not materially changed over the last few years on our observations, reflecting the fact that these banks have the inherent advantage of having created efficient structures to fit their portfolio/ capital requirements as well as experience in engaging with their respective regulators. Experience with regulators is a key factor for successful CRT transactions in our opinion, given the absence for now of a prescriptive, rules-based regulatory framework for such deals (see section below). The in-house capabilities and infrastructure needed for CRT transactions can often be barriers-to-entry for new entrant banks in the CRT space.
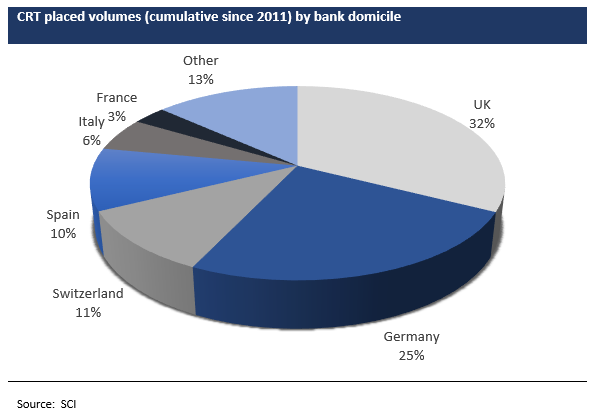
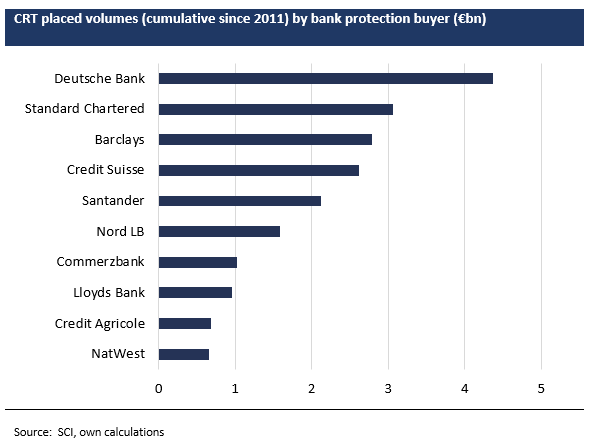
The chart below shows the (observed) cumulative issuance volumes by bank domicile, highlighting the continued dominance of German and UK domiciled banks. As mentioned above, Santander has also been notable for ramping up their CRT activities in the past 12 months and we understand that French IRB banks have also become more active. But all things considered, the CRT issuer base remains somewhat concentrated relative to other capital market types. Any significant broadening of the issuer base would, in our view, require a conducive (and certain) regulatory framework, more transparency and better pricing ultimately for placed tranches, which in turn will necessitate further maturity and depth in the investor base.
EIF/EIB programmes continue to be important for the smaller and mid-sized banks tapping the CRT market, with such banks typically using the standardised approach. Reference assets in this case continues to be dominated by SME risk.
Arguably the most interesting development in the last 12 months was the embracing of CRT technology by a number of supranational and national promotional institutions. The Room-2-Run transaction from the African Development Bank was the first synthetic securitization by a multilateral development bank as a protection buyer freeing up capital. The deal involved a $1bn portfolio of 40 loans to financial institutions and project finance vehicles across Africa. Separately, the Dutch development agency FMO initiated a new program (‘Nasira’) whereby the agency can act as both protection buyer and protection seller, depending on risk motive. The novel program works with partner banks in developing markets such as Africa and the Middle East, ultimately enabling loan credit provision domestically to underserved SME market segments. We feel more such CRT activity from supras and promotional banks will be forthcoming, but recognise that much will depend on the extent of stakeholder support for, and endorsement of, capital relief trades.
The Investor Base
Evolving, Slowly
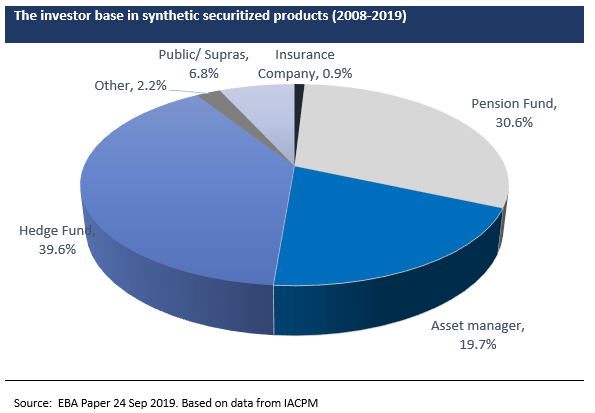
While there have been some new buy-side players coming into the CRT market over the past year, we would see the established incumbents – namely alternative credit/ hedge funds and a few pension funds – as continuing to make up the bulk of demand for the asset class. This intelligence is corroborated by the recently published IACPM findings, which also talked to the relative increase in the buy-side share of hedge funds in recent years, at the expense of pension funds.
Our own observations are that these established investors have generally increased AuM wallets dedicated to CRTs, allowing for bigger ticket purchases (EUR 100m+ sizes). This gives many such investors the ability to engage in bilateral deals, although we feel there are some issuers who still prefer syndicated (club) transactions given the potential benefits that come with such price discovery.
We also see ongoing efforts to bring more insurance companies into the market via unfunded formats, essentially as protection seller on the liability side rather than as investors in CRT tranches on the asset side. Such demand may be particularly relevant for upper mezzanine tranches, a relatively embryonic risk type that reflects the recent trend for split tranches in CRT deals (see discussion below). But to our knowledge there has been only one such confirmed transaction in the autumn 2018 referencing residential mortgages, where ING-Diba acted as the protection buyer and Arch Mortgage Insurance as protection seller. On a broader level, the recent IACPM data shows that insurance companies account for less than 1% of cumulative synthetic deal flow since 2008, albeit also pointing to an uptick in participation since 2017.
The potential demand from insurance money aside (both on the asset side as well as the liability side), it is not immediately clear in our view what the natural investor base for upper mezzanine tranches would be ultimately. Whereas we would expect some EIF activity for SME-related reference pools, the buyside for upper mezzanine risk in more traditional CRT types seems as yet uncertain in our opinion, not least considering that most of such tranches are non-rated at this stage.
Comparisons to the US CRT market
More CRT history in Europe, but still less mature
The US CRT market is younger, yet far larger than the European market if measured by deal flow. There are a number of interesting nuances, however.
The US CRT market benefits from a broader and deeper buyer base than for European CRT product, with such investors comprising mainstream money also, in contrast to Europe where alternative credit buyers dominate. But unlike Europe, the issuer base in the US is overwhelmingly dominated by the two mortgage agencies, Fannie Mae and Freddie Mac. Yet despite this issuer concentration, the US market is still much more liquid/ tradable than its European equivalent given that these two agencies have spearheaded a high level of standardisation and transparency across their CRT programmes, to include deep data on price and credit performance. By contrast, the European CRT market remains largely private and substantially non-traded.
To demonstrate the superior liquidity technicals in the US CRT market, we note that the Fannie Mae CAS program has seen cumulative issuance of $40bn as of July 2019, with secondary trading volumes of around $28bn in the last 12 months, over one times float of $27B. Liquidity, in turn, anchors the deeper buyer base, while also better facilitating repos and leverage-taking. For this and other reasons, the US CRT programs achieve significantly lower average protection costs relative to the European market.
Domestic investors remain the most important pocket of CRT buyers in the US. Fannie Mae has shifted to REMIC usage (Real Estate Mortgage Investment Conduit) in order further diversify their investor base. Recent initiatives suggest Fannie Mae is focussed on its programme appeal in Europe, stepping up their disclosure as a non-EU issuer in compliance with the new STS regulations covering EU investors. In doing so, Fannie launched a new website section specifically targeted at EU investors, thereby ‘exporting’ the practices of US CRT market transparency into Europe, where such disclosures are not yet visible with few exceptions.
The US CRT programs highlights clearly the potential long-term benefits to European bank CRT issuers from more programmatic issuance with bond market-style transparency and secondary liquidity support. But, for various (entrenched) reasons, we think more realistically that such maturity in the European CRT market is still some ways off.
Transaction Structures
Testing the product’s versatility
CRT transaction structures continue to be defined by regulatory considerations for the most part. In the absence as yet of any new regulatory framework that could shape (or re-shape) structural norms, there has generally been limited changes to deal structures since our report a year ago, save for a few notable developments as outlined below.
Most CRTs continue to be in synthetic format, however ‘full-stack’ true sale securitizations have become more prominent over the past year in the case of non-corporate reference assets such as auto and consumer portfolios. In such true sale deals, all tranches are normally sold subject to risk retention requirements (typically vertical with 5% retention of all tranches), though in some cases the senior notes are retained. The treatment of excess spread poses particular challenges in cash, full-stack securitizations, specifically because such income can be considered a securitization position from a regulatory perspective. Given the typically high excess spread in the likes of consumer or auto credit, the resulting capital consumption (in normal loss scenarios) can prove potentially prohibitive for the protection buyer, in that any capital relief from buying protection for the entire portfolio can be negated. While deal cash flow mechanics could possibly be tweaked so that any excess spread is extracted higher up the waterfall, we feel that there are no easy structural solutions that would comply with the spirit of the regulatory objectives in this respect. Our own view on this widely debated topic is that using a ‘gain-on-sale’ approach for future risky income that crystallizes such cash flow into a day-one securitized position held by the issuing bank (subject to capital requirements) may in some cases create disproportionate demands on capital relative to the capital position in a like-for-like unsecuritized portfolio.
In our opinion, the most significant structural development in the last 12 months has been the trend of greater tranche thickness among CRTs in order to achieve significant / commensurate risk transfer. Historically, based on our calculations, the average ratio of placed tranches to portfolio notionals in Europe was around 7%. More recently, we see this ratio frequently in the 10-11% area, which is notably different than the IACPM data for the global synthetic market (7.2% in 2018 vs 8.1% in 2017). Analysing what type of asset portfolios have been most impacted is challenging given the many different individual, transaction-specific parameters that also drive tranching. With thicker tranches generally, protection cost efficiency has clearly deteriorated for CRT issuers, mitigated to some extent by more dual tranche deals whereby an upper mezzanine tranche with lower clearing spreads is carved out. The development of thicker tranched CRTs is less noticeable among UK banks, however, reflecting the long-held PRA requirement for CRT tranches to be rated, which often necessitates thicker tranches than otherwise.
A key topical consideration in the CRT market is how to potentially synchronise CRT transactions with IFRS 9 accounting – that is, using capital relief technology to also deliver accounting benefits (release of loan provisions). The idea would be to reconcile credit event definitions more clinically with the IFRS 9 provisioning definitions, which to us amounts to a greater harmonisation of internal accounting and credit management policies. In practice many deals arguably already provide for IFRS Stage 3 loss coverage with the ‘failure to pay’ credit event typically capturing late-stage (90+ days) delinquencies, but efficiently (and economically) replicating coverage of Stage 2 provisioning poses greater challenges. Any release of accounting provisions would also depend of course on the attachment point of the most junior (placed) tranche.
The potential emergence of non-performing CRT transactions is also a topical market discussion. We are not particularly bullish on an NPL CRT market emerging in the foreseeable future, however, given fundamentally the challenges in fitting traditional credit event definition and loss settlement mechanisms into any defaulted asset pools with only recovery-based payoffs. Italian unlikely-to-pay loans (UTPs) would arguably be more compliant with traditional CRT technology, but being capitalised as already defaulted (which we understand is the typical CRR treatment) would kill the economics of buying protection. Above all, we believe that a significant impediment to any NPL CRT market development would be the lack of alternative investor appetite for this asset class, compared certainly to the depth of demand for cash, whole loan NPL portfolios.
Regulatory Considerations
Further notable developments and more to come
The key consideration for CRTs remains the regulatory landscape for such transactions. Regulatory capital relief remains the conditie sine qua non in the use of CRTs, aside from broader risk management objectives. In the absence of a defined and prescriptive regulatory framework for CRT usage, issuers are left to demonstrate significant / commensurate risk transfer to their respective regulators in order to achieve their capital relief aims. In this regard, the EBA 2017 discussion paper continues to be a de facto guide to structuring CRTs in addition to the CRR provisions.
Given that regulators will not ex ante sign off on CRT transactions, there is deal execution risks for potential protection buyers, a challenge that is especially significant for new market entrants without any precedence in engaging with their regulator around CRTs. Anecdotally we understand that there has been some convergence of regulatory application across Joint Supervisory Teams (“JSTs”) over the past year or so which is progress given some inconsistencies of the regulatory applications across EU regulators in the past (we would note that the UK PRA has overall still the most conservative approach).
Among the more notable regulatory-related developments over the past year that we would highlight include:-
- The potential emergence of STS criteria for synthetic transactions, based around the EBA’s consultation paper which was just published. This paper proposes a fit-for-purpose STS framework for synthetic deals that replicates the various criteria inherent in the main STS framework for cash securitizations, while taking into account synthetic-specific features related (mostly) to the protection mechanism, such as counterparty and collateral risks. The EBA paper raises the possibility of a ‘differentiated’ framework with potentially preferential terms for synthetic STS, although also acknowledges that any such preferential treatment would be inconsistent with the current Basel framework for synthetics. In our view, STS eligibility – while definitely welcome – is from an overall market perspective arguably less relevant for CRTs at this stage, in that transactions are ‘bottom-up’ whereby (largely unrated) junior tranches are sold to investors typically unconstrained by regulatory capital requirements. Moreover, senior CRT tranches are almost always retained in the current market, save for some deals involving banks using the standardised regulatory approach. In the case of the latter deals referencing SME assets, we would note that there is already STS treatment in effect for senior tranches under certain conditions as outlined in CRR Art. 270. All that said however, we recognize that STS eligibility would be a powerful de facto endorsement of the asset type, which should ultimately take the market out of the fringes and into the mainstream by both de-stigmatizing and standardising the product, in addition to more favourable capital treatment most relevant for the retained senior tranche. The STS discussion paper also highlights two important structural aspects: STS labelled transactions would not be allowed to have bankruptcy of the protection buyer (i.e. originator) as a termination event. Moreover, synthetic excess spread could not feature in an STS transaction. On the latter, we continue to believe that synthetic excess spread should be allowable to the extent that it would cover expected losses of the reference portfolio.
- The start of 2019 saw the implementation of the new disclosure regime (under the Securitisation Regulation) based on Art. 7 STS, the scope of which extends to private transactions. Most importantly, CRT deals have to follow the respective ESMA loan-level and (ongoing) investor report templates. This can be challenging in some areas given that the ESMA templates were essentially drafted for true-sale, cash securitizations and, as such, not all data fields can be seamlessly populated in the case of synthetic CRT deals. The ESMA templates do have a specific sub-section in the significant event report template for synthetic transactions (Annex 14), although this is not relevant for private
- The one key structural obstacle for efficient transactions remains the treatment of excess spread, both for true-sale and synthetic CRTs. We sense there is a consensus emerging to have a one-year (rather than cumulative) capital deduction if the synthetic excess spread is at or below the 1-year expected loss of the portfolio, based on an ‘use-or-lose’ approach (the recent EBA STS paper notwithstanding). For true-sale ‘full stack’ deals, any regulatory interpretation of (cumulative) excess spread as a securitization position can be a significant impediment to transaction economics, as discussed above.
Risk/Return Update
Recent data confirms historical credit (out)performance, underscoring value
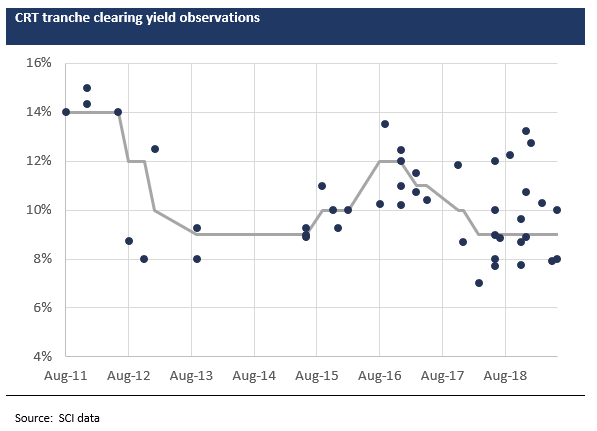
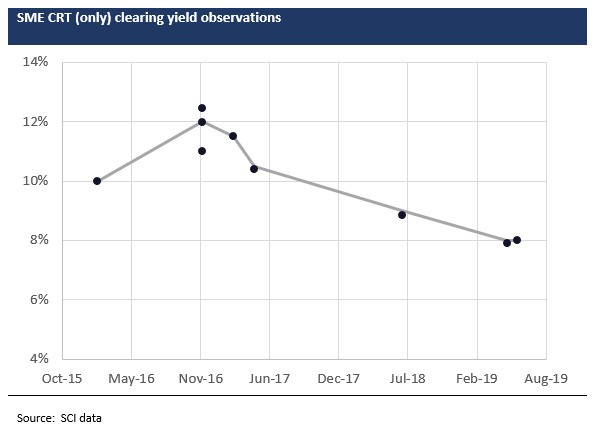
Large cap corporate and trade finance CRT yields (measured by primary market clearing coupons) have largely remained range-bound since our last report a year ago, albeit with a modest tightening seen in the range. On our observations, such CRT yields have trended between 8-12% in the past year, versus 9-12% in the preceding year. SME CRTs, by contrast, look to have tightened more perceptibly, typically pricing 1-2% inside of equivalent deals from 1-2 years ago.
Overall pricing behaviour continues to depend mainly on macro supply/ demand technicals – more specifically, as we had articulated last year, CRT pricing has remained enveloped by the return thresholds of the specialist investor base on the one hand, and the cost of bank equity on the other. The only meaningful exceptions to this otherwise range-bound pricing dynamic are deals where there is supra involvement (essentially EIF/EIB) as guarantor/ protection seller or investor in the capital structure. Both factors mentioned above – the narrow investor base and bank cost of equity – have remained largely unchanged over the past year, which in turn explains the stickiness of CRT yields. To be sure, liquidity in the CRT market still remains conspicuous for its absence, leaving few directional forces to allow spreads to break through their (long-held) resistance bounds. The lack of liquidity, or mainstream capital market sentiment more generally, has meant that CRTs remain an uncorrelated asset type versus public or tradable risk markets.
By almost any measure, CRT headline yields continue to look compelling versus most other comparable instruments, ignoring any justifiable liquidity premium. We would consider ‘comparable’ products as the likes of securitized residuals (including CLO equity) and bank AT1s or CoCos, which we discussed in some detail in our report a year ago. In the current market, as it was then, CRT yields remain generally superior to such comparables, except arguably for some CLO equity where returns may be indistinguishable from CRTs. We explore the relative value in more detail below.
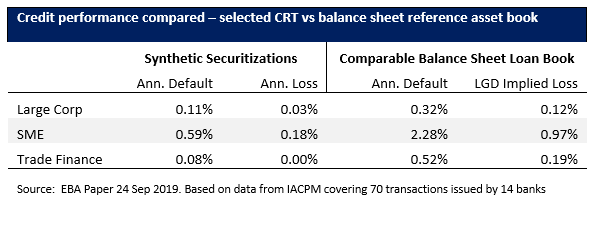
First, we feel its worth looking into the risk performance of CRTs, which the recent EBA paper is uniquely insightful courtesy of IACPM and rating agency data. (CRT loss performance data was generally unavailable before). Over the period from 2008 to 2018, the data shows that annualized default rates among large cap and SME reference portfolios amounted to only 0.11% and 0.59%, respectively. Write-offs annually stood at 0.03% and 0.18%, respectively. Such credit performance stands out versus most other comparable spread product. Indeed, the recent EBA report also highlighted rating migration data from S&P that shows the outperformance of synthetic versus cash securitizations since 2008. One key takeaway from the data provided by the EBA report is that the credit performance of synthetic reference pools has been consistently superior versus the same balance sheet (unsecuritized) assets of the institution – this suggests that there is an element of positive asset selection in the case of CRTs referencing core bank assets.
To provide slightly more balance to the bullish credit history described above, we would note that a few CRT deals were vulnerable to high profile UK-based corporate defaults over the past couple of years, to include Carillion, Interserve and selected others in the retail sector. We do not know the end-impact of such credit events at any deal-specific level, but these episodes are a reminder of the inherent portfolio risks among CRTs to idiosyncratic, single-name credit events in what can often be lumpy pools.
The above notwithstanding, richer-than-market CRT yields – in the context of its superior credit performance historically – underscores the compelling value in the asset class in our view, certainly for buy-and-hold money that can withstand illiquidity. Let’s compare with leveraged loan CLO equity, as a case in point. Nominal horizon returns on both CRTs and CLO equity is roughly in the same region, i.e., around 10-12% annually. Leverage, as measured by attach/ detach points, is also generally comparable. Yet CRTs have, historically at least, outperformed CLOs by an appreciable degree – since the 2008 crisis, CRT annualised default rates of 0.11% (large cap corporate reference assets) compares with leveraged loan annual default rates of 3.1% (Source: Fitch). The differences in default rates speak to the typically superior asset credit quality in CRTs versus CLOs, enhanced by likely positive credit selection in the case of CRTs. Moreover, the CRT coupon stream (protection premiums) is not vulnerable to lifetime portfolio cash flow risks, as in the case of CLO equity returns. CLO equity trades in a far deeper institutional market than any CRT product, however.
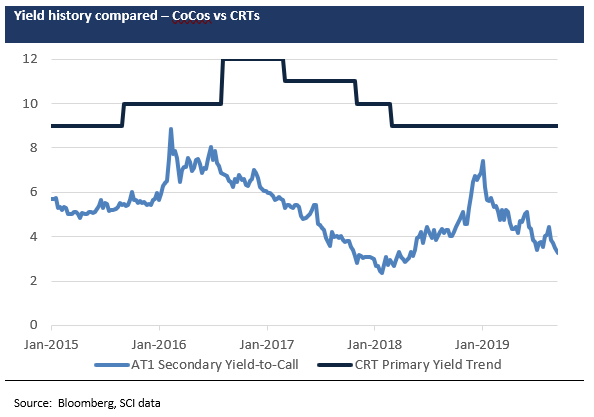
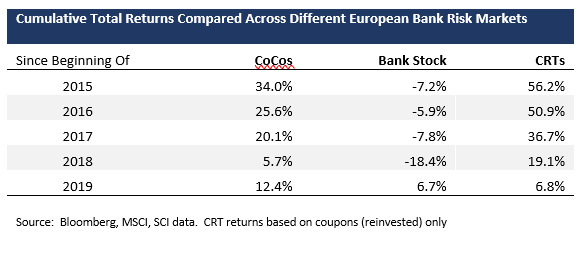
In our last report we discussed relative value considerations in comparing bank AT1s/ CoCos to CRTs, with the premise being the hybrid-equity parallels of both product types, notwithstanding some fundamental differences. CoCos have posted impressive cumulative total returns since 2015 (see table below), with yields-to-call currently (ca. 3-3.5%) re-approaching the historic tights seen in 2018. Yet CRTs can be shown to have outperformed based purely on coupon carry, at least using similarly discrete cumulative periods. The one exception is 2019YTD, during which reflation drove a sharp rally in high-beta spread products such as CoCos, whereas illiquid CRTs witnessed no similar correlated benefit. Our point here is that any outsized returns in non-traded, non-mainstream paper such as CRTs can only be fully realized over longer holding periods, with high coupon rolls making up for the anchored pricing.
Fundamentally, to recap our arguments from a year ago, CRTs provide for levered but narrow exposures to defined bank-originated asset credit risks (only), whereas AT1s/ CoCos (or bank stock, in the extreme) represent levered exposures to a broader mix of risks to further include operating, financial and event risks. Balance sheet credit deterioration (taken in isolation) has been far rarer a catalyst in triggering sell-offs in bank risk instruments over the recent past, relative to other risk factors. This arguably justifies the return outperformance of CRTs hitherto.
The potential for a better convergence of CRT pricing with its credit fundamentals remains very limited for now, at least in our view. For CRTs to trade like say CoCos, the market will need to be substantially “mainstreamed”, in terms of the buyer depth, dealer market-making, credit and price transparency and, not least, greater regulatory inclusion. Despite moving gradually in this direction, we do not feel that any such transformation will be seen in the short-term.
Disclaimer
The information in this report is directed only at, and made available only to, persons who are deemed eligible counterparties, and/or professional or qualified institutional investors as defined by financial regulators including the Financial Conduct Authority. The material herein is not intended or suitable for retail clients.
The information and opinions contained in this report is to be used solely for informational purposes only, and should not be regarded as an offer, or a solicitation of an offer to buy or sell a security, financial instrument or service discussed herein.
Integer Advisors LLP provides regulated investment advice and arranges or brings about deals in investments and makes arrangements with a view to transactions in investments and as such is authorised and regulated by the Financial Conduct Authority (the FCA) to carry out regulated activity under the Financial Services and Markets Act 2000 (FSMA) as set out in in the Financial Services and Markets Act 2000 (Regulated Activities Order) 2001 (RAO).
This report is not intended to be nor should the contents be construed as a financial promotion giving rise to an inducement to engage in investment activity. Integer Advisors are not acting as a fiduciary or an adviser and neither we nor any of our data providers or affiliates make any warranties, expressed or implied, as to the accuracy, adequacy, quality or fitness of the information or data for a particular purpose or use. Past performance is not a guide to future performance or returns and no representation or warranty, express or implied, is made regarding future performance or the value of any investments. All recipients of this report agree to never hold Integer Advisors responsible or liable for damages or otherwise arising from any decisions made whatsoever based on information or views available, inferred or expressed in this report.
Please see also our Legal Notice, Terms of Use and Privacy Policy on www.integer-advisors.com