
Capital Relief Trades or Credit Risk Transfer or Complex Regulatory Transactions even – An Executive Summary
5 July 2018
![]() Exploring CRT Opportunities (PDF version)
Exploring CRT Opportunities (PDF version)
The market for credit risk transfer / capital relief trades (CRT) in Europe can trace its origins back some twenty years, coinciding with the fusion of CDS and securitisation technology to adapt to bank loan portfolio risks. But that same synthetic securitisation format used at the outset for hedging/ capital management purposes evolved subsequently to become a directional or arbitrage trading tool (mirroring the evolution of single-name CDS), culminating in the correlation-derived synthetic CDO market which, of course, did not survive in the aftermath of the 2008 crisis. Yet the market for capital relief trades has enjoyed a renaissance in recent years, defying the stigma associated with “synthetic” securitisations.
The market’s post-crisis gentrification has been underpinned by the return of simpler structural formats that resemble the earlier generation of the product type, still aimed at regulatory capital / exposure management but with a dimension also of front-book ‘risk sharing’ between protection seller and buyer. Banks that buy protection via CRT deals still generally tend to be the larger, IRB-based institutions, with reference portfolios mostly comprising higher RWA asset types. (We use the term RWA in this commentary but note the current convention of ‘RWEA’). Contemporary CRT structures have evolved to keep pace with the continuous nature of banking/ regulatory capital regimes, with the unfolding SRT framework likely to prove especially pivotal in shaping the CRT market to come. Indeed, the impact of regulatory direction influences CRT structures and deal flow far more than investor appetite, in our view at least.
CRT deal volumes have been relatively significant in the recent past, totalling on our estimates around €20-25bn in placed volumes over the past five years. This is appreciable both compared to traditional securitisation issuance as well as in the context of public equity raised by European banks over the same period. Unlike the first generation of synthetic CRTs however, deal flow today is executed mostly privately, with bilaterally negotiated trades not uncommon also. Our discussion herein is limited to performing loan CRTs.
Mirroring the dominance of privately placed deals is the relatively niche investor base in the post-crisis CRT vintages. Such buyers comprise alternative investors mostly. CRT pricing continues to be largely bound by the return thresholds of this specialist investor base on the one hand, and the cost of bank equity on the other. Certain exceptions to this otherwise range-bound pricing dynamic are deals where there is supra involvement (essentially EIF/EIB) – such trades, where the supra acts as guarantor/ protection seller or investor in the capital structure, have been conspicuous in recent years reflecting the extent of public money earmarked to support SME lending. The role of supras in this regard has created a better seller’s market in SME CRTs (only), arguably at the expense of crowding out institutional money in that space.
Broadly speaking, investing in CRTs is tantamount to re-underwriting the economic capital justified by a reference portfolio, namely by sizing expected and unexpected losses over the deal’s horizon. CRT investments are inherently risky given where they sit in the securitised capital structure, but the equity-like coupons provide for higher absolute yields relative to bank balance sheet comparables such as AT1s as well as most cash securitisation residuals, save perhaps for leveraged loan CLO equity. CRT returns have certainly been superior to bank stock returns in the recent past, with this uncorrelated outperformance merited we believe by the fact that CRTs provide isolated exposures to defined loan portfolios within going concern bank lending models, safeguarded from other bank-related risks, whether event, operating or regulatory related.
Going forward, we think the CRT market is poised for further – potentially significant – growth, noting fundamentally the continued capital pressures on banks and the product’s versatility as a capital accretion tool, certainly relative to any public, dilutive equity issue. However, a productive regulatory regime will be a necessary pre-requisite for CRTs to have any lasting economic viability, with regulatory qualification also desirable as a means of broadening institutional buy-side liquidity in the CRT market. Such regulatory endorsement will also be key in substantially de-stigmatising the synthetic CRT market, which we see as a particularly meaningful milestone for this asset class.
CRT market technicals in Europe
Securitisation technology has long been used to transfer first/second-to-default risks related to bank credit portfolios to third party investors, existing in some format or the other since the very inception of the asset-backed market in Europe. Such credit risk transfer / capital relief trades have occupied a parallel (albeit much smaller) footprint in the securitisation market alongside more traditional funding trades ever since the first BISTRO transactions in the late 1990s.
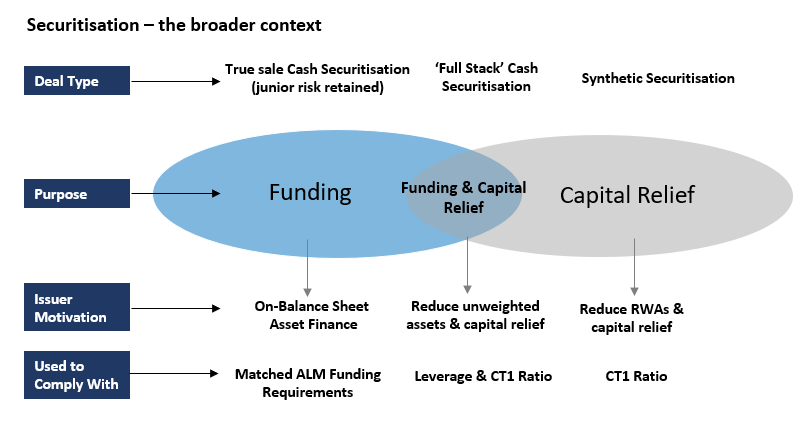
For the purposes of this commentary, we define CRT as trades structured for the sole purpose of meaningful credit risk transfer – whether for the reasons of capital or exposure management – without any asset mobilisation and therefore funding utility. And so it follows that CRTs – in our definition here at least – are distinguishable from true sale, funding-based securitisations even in latter cases when there is an element of credit risk transfer via the sale of the riskiest slices of such deals, for example in ‘full-stack’ ABS or CLOs where the residuals or equity are also placed. By our definition therefore, CRT trades are synthetic in nature in that assets remain on the balance sheets of the bank, with risk transfer accomplished through the use of credit protection mechanisms. The fundamental concept remains alien to many mainstream investors, however in practice we see CRT as not substantially dissimilar, or any more complex, to a portfolio excess of loss insurance or guarantee which is a long-established practice in the credit insurance industry.
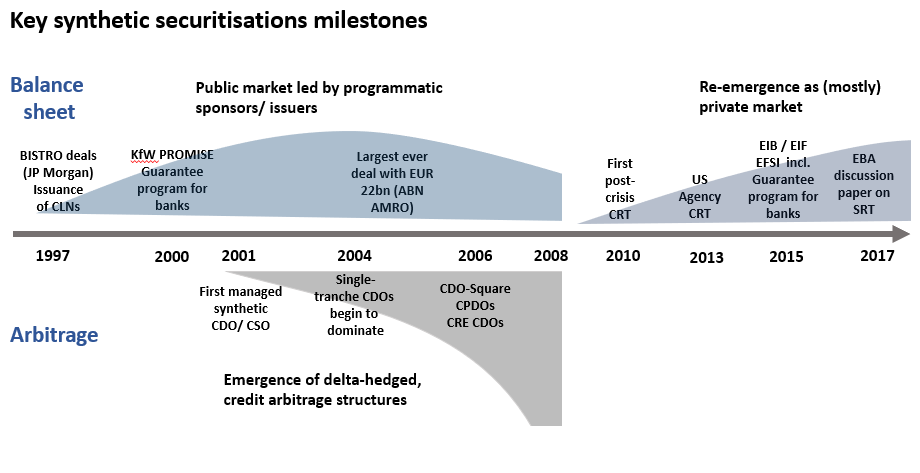
The synthetic market has gone through two distinct cycles since its inception, each either side of the 2008 crisis. The pre-crisis period was initially characterised by the gradual ‘industrialisation’ of synthetic securitisation technology as an effective credit risk transfer tool under the auspices of Basel I, which prescribed simplistic, ‘one-size-fits-all’ capital treatment. CRT deal flow became established among certain programmatic sponsors (eg KfW) and banks as a means of capital/ risk management of balance sheet (and inherently illiquid) loan assets, often via full synthetic capital structures. But by mid 2000s, the technology evolved in parallel into an arbitrage, delta-hedged trading tool, used in replicating or leveraging corporate credit into tranched formats. (Thus, the product’s use evolved from hedging to directional trading). Such synthetic CDOs eclipsed the regulatory capital based ‘traditional’ CRT deal type by 2006/7 but did not of course survive the 2008 crisis.
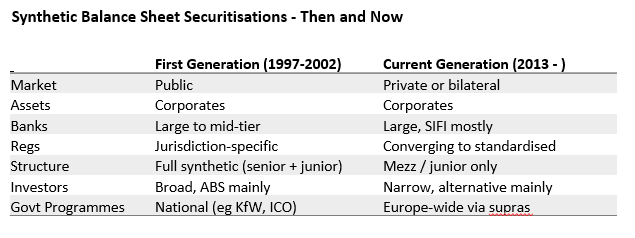
The stigma overhang subsequently associated with “synthetic” securitisations largely shut the market down for a few years in the immediate aftermath of the 2008 crisis. But prolonged pressure on bank capital (and the relatively expensive access to such equity), among other factors, brought deal flow back, with the current profile of transactions resembling the earlier generation of synthetic securitisations, i.e., tools for capital and risk management of non-tradable loan credit portfolios held by banks. CRT market growth has been appreciable in recent years, driven by larger banks across a range of assets in the higher capital consuming categories.
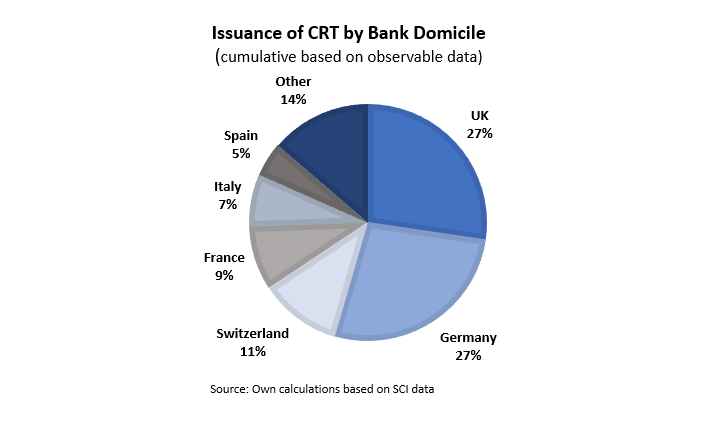
The vast majority of the re-emerged market is now private or in some cases bilaterally negotiated, with very few being public, in distinct contrast to the pre-crisis market. Given the largely private market, there is little by way of accurate data on synthetic tranche volumes. According to SCI data, observable deal flow in recent years was around €3.5-4bn annually (excluding EIB/EIF transactions) but reported volume data in this respect is incomplete. We estimate that placed CRT tranches totalled around €5bn annually over say the last 3 years, with these estimates based on guidance from available data as well as market feedback. (Some market observers estimate volumes as high as €6-7bn annually). On a cumulative basis, we think around €25bn of CRT tranches have been placed over the post-crisis era, referencing portfolios totalling €250-350bn area, on our estimates.
On most measures, however, synthetic CRT deal flow over the past couple of years have amounted to roughly 5-6% of traditional cash securitisations, which we think is not an insignificant representation. That aside, on our basic calculations – premised on assumptions around the estimated degree of RWA migration with each trade – the regulatory capital released has ranged (roughly) between €25 and €30bn. We consider this an appreciable amount in the context of public rights issues from banks (ca. €220bn since 2011, according to Bloomberg), or indeed AT1 issuance (ca. €230bn since inception), Yet we feel that the role of CRT trades in bank capital management in Europe remains generally under-appreciated.
Our data above excludes securitisation deal volumes executed by the EIB/EIF group. Under the EC’s Investment Plan for Europe (the “Juncker plan”), institutions such as the EIB/EIF have played an influential role in providing credit protection to banks with the targeted aim of redeploying freed up capital into new SME lending. Over the past three years, EIB/EIF invested volumes have amounted to over €1.5bn, referencing over €30bn of SME loan portfolios (Source: EIF).
Unlike the earlier generation, current deal flow is limited mostly to the placing of junior or mezzanine risk. And mirroring this, the investor base has become narrower. According to the 2015 EBA report, the CRT investor base was made up largely of hedge funds (47%), pension funds (22%) and sovereign-wealth funds or public/supranational investors (20%). We generally concur, save for the observation that the role of supras has likely increased in recent years, as have the prominence of specialist high return investors. To be sure, regulated capital investors such as banks and some insurers will be disinclined to invest in CRTs given the prohibitive capital charges (normally dollar-for-dollar).
As a final point of comparison, the US CRT market is very active also (more than $40bn in tranche volumes issued last year), but the market is conspicuously – and overwhelmingly – dominated by the two mortgage agencies, Fannie Mae and Freddie Mac. The buyer base for such CRT trades are broad, with REITs known to be significant investors in the asset class. In that sense the US market technicals are the mirror of Europe’s, in that there is a noticeable concentration of names on the issuer side, seemingly much less so on the buyer side.
Regulatory capital accretion & exposure management – the key bank CRT motivations
The genesis of the issuer motivation driving CRT trades has always been and continues to be primarily in optimising capital usage against ‘hedge-able’ loan books, overlaid in some cases by the desire for better exposure management. (We use the term ‘hedge-able’ to denote assets that can be adequately analysed by protection sellers, given established traded risk markets and/or comprehensively available data). Indeed, as an asset class, CRTs have endured as an ‘inter-generational’ de-risking tool, spanning the full evolution of Basel capital accords from I to III. We expand on the issuer motivations below:-
- CRT’s basic commodity value is in allowing the release of regulatory capital tied to a specified pool of loan assets. This is in many cases complemented by exposure management (both sectors and single-name limit), specifically in the case of larger corporates as reference portfolio
- The use of CRT is often targeted for the purposes of capital release specific to a line (or lines) of business. Factors such as exposure management and divisional risk pricing discipline (for example, the desire to redeploy inefficient capital when held against loans originated as loss-leaders for other ancillary business) are also are key rationales behind such trades
- Asset selection tends to have some commonality across CRT issuers. Most loan types referenced in such trades are RWA-intensive assets, typically corporate exposures from large cap to SMEs, CRE loans and duration-rich credit assets such as project or infrastructure loans. By contrast, retail asset classes such as residential mortgages or consumer loans are rare in CRT deals given relatively low RWAs. CRT-referenced loans tend also to be assets core to the bank rather than run-off books, this aspect reflecting both the seller’s going-concern capital management considerations and also investor demands for better alignments of interests. For the same reason, it is rare to see capital relief trades from stressed or distressed institutions
- Banks buying protection via CRT trades are often large institutions (mostly systemically important) using IRB models. The use of CRT by standardised banks by comparison is still relatively rare, though becoming more common. Reasons for the under-representation of standardised banks include the need for external ratings on any retained senior tranches (or, alternatively, the need to place or guarantee such tranches), which of course adds to transaction costs, as well as portfolio data and reporting challenges. That said, there have been few CRT trades from standardised banks, notably including EIF involvement under their European SME initiatives.
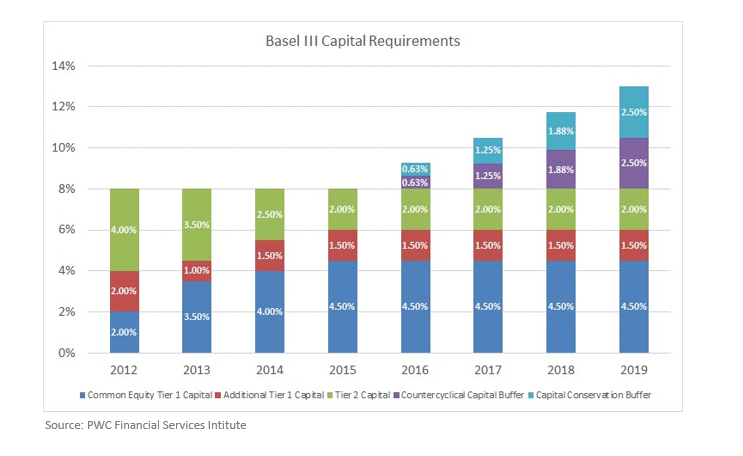
Fundamentally, of course, the re-emerging CRT market is being fuelled by greater regulatory capital demands on banks, particularly universal models, over the post-crisis era. Managing compliance to such capital demands has led to newer funding markets in equity, equity-linked and/or TLAC instruments on the one hand, and asset de-risking via RWA reductions on the other. Aside generally from non-core/ NPL asset divestments by banks in recent years, CRTs have played an important role in the latter RWA mitigation strategies, with one of its key benefits being that it is non-dilutive to the capital structure.
With the direction of regulatory capital requirements generally continuing to drift higher, the impetus for CRT deal flow should remain strong. The imposition of leverage ratios on the banking system should add a further dimension to such trade types, in that complying with these rules requires a reduction in total (unweighted) assets, in effect an accounting deconsolidation. This should fuel more ‘full-stack’ cash securitisations with first loss (CRT-like) tranches distributed also, allowing for both regulatory capital and balance sheet asset relief. We see the key difference in such full-stack deal flow, relative to current CRT trades, being the assets used, with the former likely biased to lower RWA (nominally asset heavy) loan types.
The recent adoption of IFRS9 will also potentially add a new dimension of issuer incentive behind CRT trades to come. IFRS9, which came into force earlier this year, forces lenders to recognise upfront expected losses over one-year or the lifetime, depending on the prescribed ‘three-stages’ of the loan. CRT structures could potentially be employed to mitigate such costs as part of the credit risk transfer mechanism inherent in such trades. The precise structural format and accounting/ regulatory treatment is still evolving in our understanding.
It should be noted that, like cash securitisations, CRT trades demand operational capabilities across front-mid-back offices to appropriately book, account and manage loans that have been hedged. This necessary requirement means that banks without adequate functionalities (like more extensive data capture) may be challenged in doing SRT trades. Bank CRT issuers need also to manage their capital positions going forward given call features and amortisation although we would argue that the ‘flowback’ risk is not substantially different to AT1 issuance, all things considered.
Synthetic CRT structures – shaped mainly by regulatory regimes
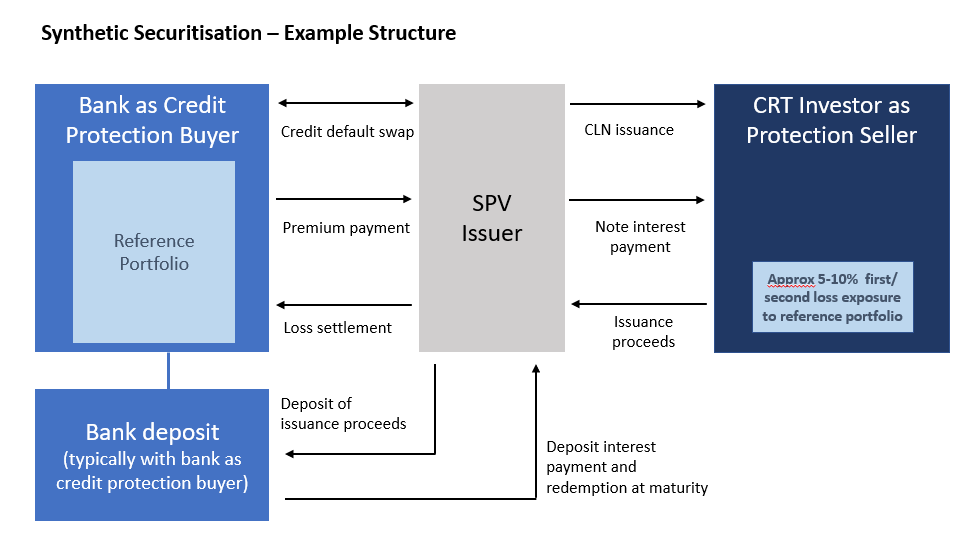
The current generation of CRT deals is largely similar in structural style and format to the first generation from the early 2000s, with only few exceptions. (One key difference being the predominantly private nature of CRT trades today). In its most fundamental form, a CRT structure is designed to simply transfer a pre-determined portion of credit loss risk related to a specific loan portfolio to the protection seller(s). While there are different structural permutations, especially in the case of bilaterally-negotiated deals, the basic transaction steps can be outlined as such:-
- The bank enters into a credit protection agreement (normally CDS) with the protection seller, typically via an intermediary SPV. (It should be noted that some trades provide loss protection or guarantees directly, without any SPVs). The SPV issues CLNs or equivalents to the investor to mirror the CDS or guarantee economics
- In return for the protection premiums paid, the CRT investor agrees to cover losses based on pre-determined events, with settlements calculated in an interim format with so-called ‘true-up’ mechanisms which mirror the actual recovery performance of a loan
- Investor proceeds are deposited into an account – commonly held at the issuing bank – which is used to collateralise the portfolio insurance inherent within the CRT structure
- From a cash flow perspective, the deposit is reduced by the amount of crystallised lifetime losses, while the carry is used to supplement the protection payment stream to investors.
Beyond the basic structural elements as outlined above, CRT deals are further layered with features that detail aspects of portfolio replenishment, tenor of credit protection, scope and profile of payouts/ events, economic skin-in-the-game, among other considerations. This can, depending on the precise structure, introduce an element of complexity as far as traditional investors may be concerned. We summarise key CRT structural features in the table below, but before elaborating on such features we first touch on the regulatory aspects of CRTs. CRT structural designs are borne mostly out of regulatory considerations.
The raison d’etre of any CRT trade – the freeing up of capital – depends crucially on compliance with regulator’s requirements in this respect, namely by demonstrating that commensurate or significant risk transfer (SRT) has been achieved under the CRT deal. The overriding concern of regulators is to avoid regulatory capital arbitrage, or capital leakage risks, ensuring therefore that capital relief is fully commensurate with the transfer of economic (credit) risks.
Such SRT ‘guidance’ in itself is, at this stage, not all that straightforward. The Basel II/III rules, which are encapsulated within the CRR in Europe, sets the basic framework for SRT compliance, with this complemented by guidance provided by jurisdiction-specific authorities. More recently, the ECB’s SSM coverage of systemically important banks in Europe has given it a voice over such rules also. Overlaying all of this is the EBA’s ongoing efforts at harmonising the EU’s rule-book for SRT, which may not be formulated into legislation before 2019/20 – nonetheless, the EBA’s current discussion paper (issued in September 2017 with an ensuing consultation phase) appears to set guiding principles for CRT trades currently, at least for some banks and their respective regulators. There are notable variations, however, for example the UK’s traditionally conservative or ‘gold-plated’ approach, as recently evidenced in the PRA’s consultation paper
Looked at holistically, SRT regulatory literature remains somewhat complex reflecting various prescriptive tests and criteria determining best practice. Discussing SRT details is beyond the scope of this commentary focussed on CRT capital market (investor) opportunities. But suffice to say that SRT guidance in various regulatory rule-books, including proposals in the pipeline, is what shapes both CRT structures as well as the protection cost-benefit balance that underpins issuer incentives and deal flow ultimately. Indeed, the impact of regulatory direction in this regard influences CRT structures and deal flow far more than investor appetite, in our view at least.

Among the key broader structural features of CRTs that come out of compliance with SRT frameworks or guidance include:-
- Tranching. CRT typically involves the placement of mezzanine (second-loss) tranches above first-loss exposure retained by the bank – the thickness of this retained first loss tranche in an important determinant of both investor protection as well as bank capital efficiency. Senior tranches are retained in the case of IRB banks. Mandatory securitisation skin-in-the-game requirements (minimum 5%) is normally achieved via vertical or alternative balance sheet retention mechanisms
- Sequential vs pro-rata amortisation. Sequential structures generate increasing costs to the issuer over time which can make CRTs uneconomical over the deal’s life. Pro-rata structures (with performance-based switch triggers) are more cost-effective and can also be more investor-friendly but are generally unwelcome by regulators given the erosion of credit-protection, specifically in back-loaded stress scenarios. Replenishment periods for a number of years are common
- Call optionality. CRT structures typically have embedded issuer calls options in the form of clean-up, time and regulatory calls. Time calls represent early protection redemption options for the issuer, which would usually be exercised when the cost of the trade outweighs any benefit from capital relief or loss coverage, but normally not before the portfolio WAL for regulatory reasons. (Time calls also have to fulfil other regulatory conditions). Regulatory calls are more specific to regulatory events that negate any capital benefit to having the CRT outstanding, allowing the issuer to collapse the trade. Regulatory calls can therefore potentially be ‘in-the-money’, as it were, given the continuously evolving regulatory environment
- Protection premium payments. Premiums paid to CRT investors can be structured as fixed coupons vs contingent payments, with the latter payments reduced proportionately in line with portfolio losses assumed by the protection buyers during the life of the transaction
- Excess spread and other ‘soft’ credit enhancement. Synthetic excess spread – essentially a ‘top-up’ in payments made by the protection buyer – forms an additional layer of defence against expected losses beyond the first loss retained by the issuer. There are many variations to excess spread provision, both in terms of calculations as well as the availability over time. Excess spread can be trapped to form a loss cushion or structured as a use-or-lose facility available only for certain periods. The regulatory treatment of excess spread) is among the key CRT issuer considerations
- Scope of credit events definitions and loss settlement mechanisms, including verification styles. Failure to pay and bankruptcy are the two standard events of course. Restructuring as a credit event – which is a mandatory requirement in certain jurisdictions – can add a somewhat more complex dimension to analysing underlying portfolio risks. Once a credit event has occurred, loss settlement mechanisms kick-in. The process varies but typically mirror the actual recovery and/or ultimate loss related to a loan default, with internally-derived bank LGD estimates used as a first proxy
- Termination clauses. CRT deals would typically be terminated if the bank as protection buyer fails to pay the premium. In the past, termination clauses in some structures would also be triggered in the event of the bank going into resolution/bankruptcy, however regulators (rightly, we think) question the value of capital relief if the deal cannot outlive any resolution/bankruptcy of the protection buyer.
Scoping CRT investment opportunities – a largely hidden market, still
Our intent in this section is not to provide a substantive investment thesis for the asset class, however for the sake of discussion we would summarise the key investment considerations into the following segments:-
- Reference portfolio. Loans referenced in CRT trades tend of course to be higher RWA assets, which means that lifetime losses are likely to have a non-zero outcome. Given that most banks executing such trades are IRB institutions, the depth (and predictive quality) of credit data to be analysed should normally be more comprehensive than otherwise available – however on this point we would note that blind reference pools (by obligor line item) are very common, especially in the SME segment, with analysis therefore limited to portfolio-level metrics. As the CRT market matures, the risk of asset ‘creep’ into more exotic/ riskier loan types should be noted. Portfolio losses – and therefore protection payouts – are often back loaded, with this risk offset somewhat by time-value benefits
- Duration. Unlike traditional asset-backed bonds, CRT trades are layered with call options that allows the issuer to redeem the outstanding protection early, typically on a timed or regulatory event trigger as described earlier. Deal termination clauses can also of course affect CRT durations. Such early redemption manifest in investor prepayments. Conversely, there may also be certain extension risks to expected maturity to consider, related to loss settlements that may spillover beyond the redemption date
- Structural. Most of the key structural elements of European CRTs were covered in the earlier section. Aside from considerations related to these features, we would also highlight the importance of credit enhancement adequacy. While mandatory skin-in-the-game requirements in CRTs are typically satisfied via vertical retention, there is still normally a thin first loss exposure assumed by the bank. That aside, there can be provision of synthetic excess spread, which – depending on the trapping mechanism and ceiling limits – can form a useful first loss cushion before any losses assumed by CRT investors, subject to the timing of any credit losses as well as potential single obligor risks
- Alignment of interests. Vertical retention (or alternative mechnisms) provide for a lesser quantum of skin-in-the-game than retaining the full 5% horizontally often used in traditional securitisations. But the fundamental characteristics of CRT deals (that is, the selling of protection associated with portfolio equity or near-first loss risks) validates the need for alignment of interests to be demonstrated elsewhere. A key aspect of current CRT deals is that the credit protection relates to core assets/ businesses, where released capital is normally recycled back into fresh lending – this effectively mimics risk-sharing in a going-concern lending business, aligning both protection seller/ investor and the issuing bank as protection buyer/ lender. Some deals involve the random selection of assets, with the servicing and workout units unable to distinguish loans that have been hedged through CRTs – these are further factors that should be considered in the context of alignment of interests
- Deposit structure. The deposit created out of investor proceeds, which is normally held at the issuing bank, may be vulnerable to bail-in haircuts under a resolution/ bankruptcy, notwithstanding its hierarchal seniority. Ultimate CRT defeasance may therefore be impacted under such scenarios, though we would argue that the risk in this respect is remote relative to the primary reference portfolio risks. Bank downgrade and other credit-related tests that trigger segregation of the deposit funds or its replacement by, for example, government securities are potential risk mitigants in this respect.
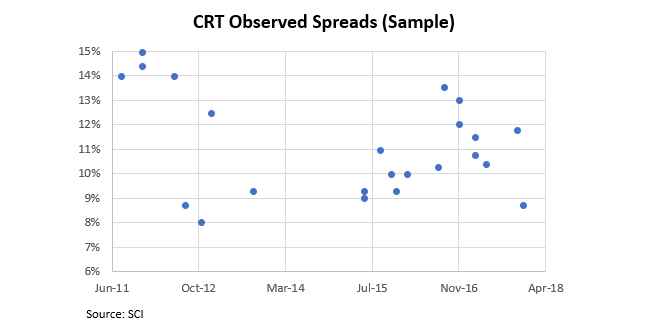
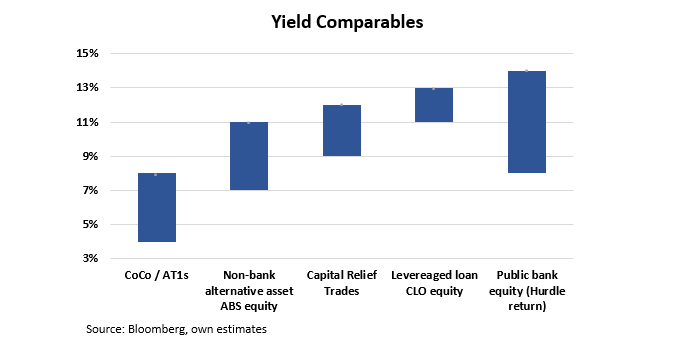
CRT trades come mostly in unrated form. Yields on such paper are normally in the 9-12% range currently (before losses) for scheduled tenors of up to seven years, where observable. On the face of it, such returns are of course attractive relative to more mainstream capital market opportunities. But noting more specifically the resemblance of CRTs to both asset/ securitised finance residuals as well as bank equity-like instruments, we make the following observations: –
- Bank securitisation equity is rare, whereas such residual-like positions are more common in non-bank securitisations, where yields normally range from 7-9% for alternative mortgage risks to 11-13% for leveraged loan CLO equity. Such yields are of course based on asset finance-derived residual income, whereas CRT payouts depend on the cost of regulatory capital/ equity to the bank, which may be entirely decoupled from portfolio yields. Both cash ABS/CLO residuals and CRTs are, fundamentally, highly levered exposures to loan portfolio risks, however – unlike cash securitisations – synthetic structures do not assume any non-credit cash flow risks, whether related to asset liquidity and/or other disruptive issuer events. Ownership of assets is normally of no relevance while deal termination is not in any way dependent on portfolio liquidation
- The most established bank quasi-equity product is of course the AT1 or CoCo market. AT1s tend to trade in the 4-8% range, depending largely on individual bank quality. CRTs are therefore appreciably higher yielding for now following the significant yield compression of CoCos in the last few years. On the one hand, CRTs are entirely illiquid relative to AT1s. But on the other hand, the risk of forced equitization/ writedowns or coupon deferral/ cancellation is a bank-wide consideration in the case of CoCos, in contrast to a defined portfolio consideration in the case of CRTs. Aside from the broader exposure to non-portfolio and/or event risks related to the issuing bank, AT1s may also be vulnerable to coupon dilution risks given regulatory reform (eg changes to MDA terms) which are otherwise unrelated to capital threshold tests
- There may arguably be some merit in comparing CRTs to public bank equity. Both instruments are, principally speaking, at the bottom of bank-related capital structures and share some degree of pricing relationship since CRT coupons are struck as a function of the cost of equity. But equally there are many reasons why bank equity and bank CRTs cannot justifiably be regarded as comparables. In any case, a cross-asset analysis in this respect would be complex and beyond the scope of this commentary, however we think it still worth noting the following return profiles: Over the past five years, European bank equity – as measured by the STOXX 600 Banks index – delivered total returns of 20%, which was made up entirely of dividends (price return near zero). In the same period, bank CRTs would have returned closer to 60%, excluding the effects of any protection loss-related write-downs. On this backward-looking standpoint, it can be argued that the isolated equity exposure to a bank’s loan book via CRTs has proved, in retrospect, an uncorrelated yet compelling alternative to bank stock. We caveat of course that this somewhat primitive comparison ignores factors such as tradable liquidity and says nothing about potential future returns from here.
Notwithstanding the higher-than-market headline yields, we think it worth noting that CRTs – unlike its traded capital market comparables (public equity aside) – have not repriced meaningfully tighter in recent years, with coupons remaining generally range-bound despite the more bullish appetite for bank debt-like risk generally. In our view, CRT pricing has remained enveloped by the return thresholds of its specialist investor base on the one hand, and the cost of bank equity on the other. Going forward, these same factors would of course remain key influential price drivers, with any normalisation in the cost of bank equity and/or investor demand technicals shaping lower and upper resistance levels in CRT pricing, respectively.
To our knowledge, alternative investable opportunities in CRTs are limited to just the one listed equity fund managed by Chenavari (CCSL) – the fund, which trades at a ca. 10% discount to NAV, has been in effective run-off since the beginning of 2017.
CRT market outlook – poised for growth, but vulnerable to regulatory outcomes
We believe the current drivers of the synthetic CRT market will continue to fuel primary volume growth going forward. Such drivers on the supply side are the more stringent capital demands on banks (overlaid also by IFRS9 considerations, potentially) and pressures to optimally manage capital/ risk exposure within many business lines. On most measures CRTs still represent a compelling tool to accrete regulatory capital, certainly relative to any public, dilutive equity issue. That said, we see compliance to leverage ratio caps driving more deconsolidated, ‘full-stack’ cash securitisations, which might cannibalise some synthetic CRT issuance over the foreseeable future, although we note that the underlying assets will most likely differ between the two forms.
On the demand side, we expect most current established CRT buyers to increase allocations into the asset class, not least as mandates have delivered superior returns relative to other alternative products. Newer CRT investors are also likely as deal flow remains strong, however we see such entrants made up mostly of alternative asset investors, mimicking the profile of the existing investor base. Therefore, with CRT investments typically made from alternative credit/ equity money with high return thresholds, we see limited scope for CRT coupons to tighten much further at this stage. For such product to break through into lower yield ranges, greater institutional liquidity – namely from more mainstream investor types – would be a necessary pre-requisite, in our opinion.
Whether such institutionalisation unfolds going forward depends largely on regulatory endorsement. Indeed, the regulatory regimes relevant for CRTs – stretching from the coming SRT framework to CRR to STS designations, among others – will be key in cementing the long-term viability of the asset class, not to mention also shaping deal structures to come. We would welcome the EBA-crafted new rules as it will allow for a harmonised (some potential jurisdiction gold-plating notwithstanding) and standardised CRT regime, which would of course level the playing field across Europe.
As the CRT market matures, we anticipate more innovations to deal and structure types. Without going into too much detail, we would see a key theme in this respect centred around aspirations for more permanent capital benefits from these instruments, whether manifesting in programmatic CRT shelves or other innovations. We expect the highly involved role of supras to remain a feature of the CRT market, potentially spearheading such innovation.
Disclaimer:
The information in this report is directed only at, and made available only to, persons who are deemed eligible counterparties, and/or professional or qualified institutional investors as defined by financial regulators including the Financial Conduct Authority. The material herein is not intended or suitable for retail clients. The information and opinions contained in this report is to be used solely for informational purposes only, and should not be regarded as an offer, or a solicitation of an offer to buy or sell a security, financial instrument or service discussed herein. Integer Advisors LLP provides regulated investment advice and arranges or brings about deals in investments and makes arrangements with a view to transactions in investments and as such is authorised by the Financial Conduct Authority (the FCA) to carry out regulated activity under the Financial Services and Markets Act 2000 (FSMA) as set out in in the Financial Services and Markets Act 2000 (Regulated Activities Order) 2001 (RAO). This report is not intended to be nor should the contents be construed as a financial promotion giving rise to an inducement to engage in investment activity.Integer Advisors are not acting as a fiduciary or an adviser and neither we nor any of our data providers or affiliates make any warranties, expressed or implied, as to the accuracy, adequacy, quality or fitness of the information or data for a particular purpose or use. Past performance is not a guide to future performance or returns and no representation or warranty, express or implied, is made regarding future performance or the value of any investments. All recipients of this report agree to never hold Integer Advisors responsible or liable for damages or otherwise arising from any decisions made whatsoever based on information or views available, inferred or expressed in this report. Please see also our Legal Notice, Terms of Use and Privacy Policy on www.integer-advisors.com